- Home
- Snow
Snow report: Diamond Peak, Mt Rose and the Tahoe resorts
Right now. The lifts are not running yet. Most Tahoe resorts open between early November and mid-December, snow permitting. Diamond Peak sits in Incline Village. The resort list below fills in with new snow and base depth after the first storm.
This page lists every Tahoe ski area in the same format: new snow in 24 hours, base depth and the time each mountain reported. Diamond Peak is inside Incline Village. Mt Rose is about 25 minutes up SR 431. Town averages about 5 inches of snow in November, 14.5 in December and 21 in January.
Snow and avalanche
Full avalanche forecastLifts and new snow
Resort reportsEach resort page has its forecast, cams and map.
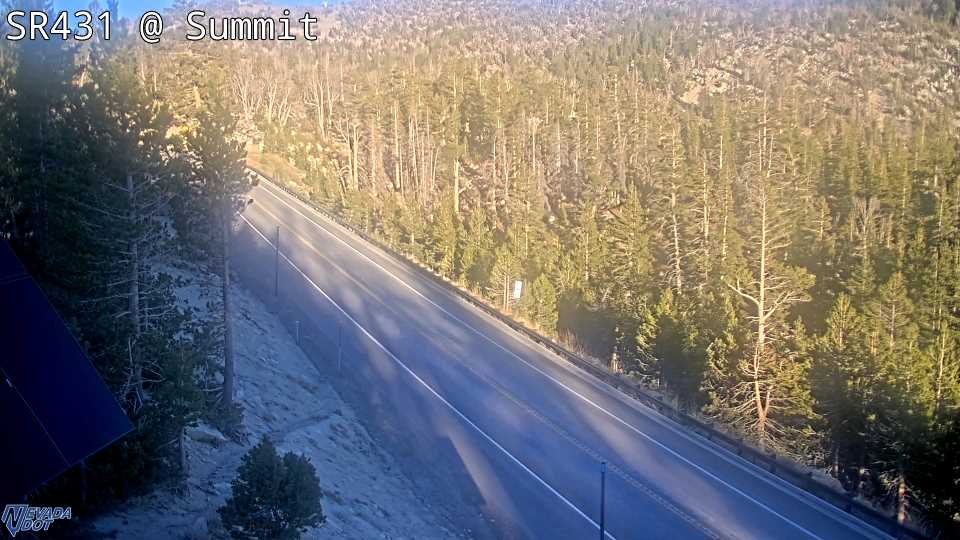
Mt Rose summit camera
All camerasMt Rose Summit SR-431, 5.7 mi NE, camera at 8,887 ft. Old snapshot from 5 PM, Oct 16
New snow by resort
Inches per day: Diamond Peak, Mt Rose and the snowiest other resortSee the numbers
| Day | Value |
|---|---|
| Oct 7 | 0.000 |
| Oct 8 | no reading |
| Oct 9 | no reading |
| Oct 10 | no reading |
| Oct 11 | no reading |
| Oct 12 | 0.000 |
| Oct 13 | 0.000 |
| Oct 14 | no reading |
| Oct 15 | no reading |
| Oct 16 | 0.000 |
This winter against the median
Inches of water in the snow at Mt Rose, by daySee the numbers
| Day | Winter 2026 to 27, so far | Winter 2025 to 26 | Median, 1991-2020 |
|---|---|---|---|
| Oct 1 | 0.0 | 0.0 | 0.0 |
| Oct 8 | 0.1 | 0.0 | 0.0 |
| Oct 15 | 0.0 | 2.8 | 0.0 |
| Oct 22 | 1.0 | 0.0 | |
| Oct 29 | 0.9 | 0.0 | |
| Nov 5 | 1.1 | 0.5 | |
| Nov 12 | 0.6 | 1.0 | |
| Nov 19 | 2.3 | 1.8 | |
| Nov 26 | 2.9 | 2.8 | |
| Dec 3 | 3.3 | 4.7 | |
| Dec 10 | 3.1 | 8.0 | |
| Dec 17 | 3.4 | 9.3 | |
| Dec 24 | 11.9 | 10.2 | |
| Dec 31 | 14.9 | 11.1 | |
| Jan 7 | 19.9 | 13.6 | |
| Jan 14 | 20.7 | 15.3 | |
| Jan 21 | 20.7 | 18.1 | |
| Jan 28 | 20.2 | 22.8 | |
| Feb 4 | 19.6 | 26.6 | |
| Feb 11 | 20.1 | 27.1 | |
| Feb 18 | 24.9 | 29.7 | |
| Feb 25 | 26.8 | 31.5 | |
| Mar 4 | 26.8 | 32.2 | |
| Mar 11 | 26.5 | 34.0 | |
| Mar 18 | 24.5 | 35.7 | |
| Mar 25 | 20.0 | 35.2 | |
| Apr 1 | 20.6 | 34.8 | |
| Apr 8 | 18.8 | 35.1 | |
| Apr 15 | 21.4 | 35.1 | |
| Apr 22 | 20.7 | 34.9 | |
| Apr 29 | 20.7 | 33.5 | |
| May 6 | 18.2 | 32.7 | |
| May 13 | 9.6 | 29.2 | |
| May 20 | 2.5 | 24.1 | |
| May 27 | 0.2 | 17.1 | |
| Jun 3 | 0.0 | 7.2 | |
| Jun 10 | 0.0 | 0.0 | |
| Jun 17 | 0.0 | 0.0 | |
| Jun 24 | 0.0 | 0.0 | |
| Jul 1 | 0.0 | 0.0 | |
| Jul 8 | 0.0 | 0.0 | |
| Jul 15 | 0.0 | 0.0 | |
| Jul 22 | 0.0 | 0.0 | |
| Jul 29 | 0.0 | 0.0 | |
| Aug 5 | 0.0 | 0.0 | |
| Aug 12 | 0.0 | 0.0 | |
| Aug 19 | 0.0 | 0.0 | |
| Aug 26 | 0.0 | 0.0 | |
| Sep 2 | 0.0 | 0.0 | |
| Sep 9 | 0.0 | 0.0 | |
| Sep 16 | 0.0 | 0.0 | |
| Sep 23 | 0.0 | 0.0 | |
| Sep 30 | 0.0 | 0.0 |
Snowpack at Mt Rose SNOTEL
Inches of water in the snow, daily averageSee the numbers
| Day | Inches |
|---|---|
| Sep 17 | 0.00 |
| Sep 18 | 0.00 |
| Sep 19 | 0.00 |
| Sep 20 | 0.00 |
| Sep 21 | 0.00 |
| Sep 22 | 0.00 |
| Sep 23 | 0.00 |
| Sep 24 | 0.00 |
| Sep 25 | 0.00 |
| Sep 26 | 0.00 |
| Sep 27 | 0.00 |
| Sep 28 | 0.00 |
| Sep 29 | 0.00 |
| Sep 30 | 0.00 |
| Oct 1 | 0.00 |
| Oct 2 | 0.10 |
| Oct 3 | 0.20 |
| Oct 4 | 0.00 |
| Oct 5 | 0.10 |
| Oct 6 | 0.10 |
| Oct 7 | 0.00 |
| Oct 8 | 0.10 |
| Oct 9 | 0.10 |
| Oct 10 | 0.50 |
| Oct 11 | 0.00 |
| Oct 12 | 0.10 |
| Oct 13 | 0.00 |
| Oct 14 | 0.00 |
| Oct 15 | 0.00 |
| Oct 16 |
Where the snow is in October
New snow is what fell in the last 24 hours. Base depth is the snow on the ground where each resort checks it. That is usually mid mountain. Resorts report each day. Some post again later. On a storm morning, a card can be hours old. The time on each card tells you.
Near Incline
- Diamond Peak sits at the edge of town, off Ski Way. The lake fills the view from the top.
- Mt Rose is the higher of the two. Its snow gauge sits at 8,810 feet, 6 miles from town in a straight line (about 12 miles by road). That height is why Mt Rose often has snow when the lake shore is bare. The road up is Mt Rose Highway, which gets chain controls first.
The rest of Tahoe
This report also covers ski areas around the lake. Palisades Tahoe, Northstar, Sugar Bowl, Boreal and Tahoe Donner are in the Olympic Valley and Truckee area, north and west of the lake. Homewood is on the west shore. Heavenly, Kirkwood and Sierra-at-Tahoe are to the south. Each area shows new snow, base depth, snow over 7 days and the report time.
How much snow is a good winter?
The Mt Rose gauge measures water held in the snow. It peaks in March or April most years. The typical peak is about 37 inches. That is our own math: the median of the yearly peaks from 1991 to 2020.
| Winter | Peak | Peak date |
|---|---|---|
| 2017 | 94 in | Apr 20 |
| 2019 | 62 in | Apr 10 |
| 2023 | 74 in | Apr 7 |
| 2024 | 37.5 in | Apr 8 |
| 2025 | 37 in | Apr 7 |
| 2026 | 27 in | Feb 24 |
2024 and 2025 landed on the median. 2026 was thin, at about 72% of it. 2023 was the winter that lifted the lake.
The Sierra Avalanche Center posts a danger rating each day in winter. Read the full forecast before you leave the resort.
Getting there
- Diamond Peak: in town, off Ski Way.
- Mt Rose: up SR 431. Check Mt Rose Highway first.
- The TART bus serves town.
Questions people ask
Which Tahoe ski area is closest to Incline Village?
When does it start snowing in Incline Village?
How was last winter's snowpack?
How much snow does Mt Rose get?
Which Tahoe ski areas are on this page?


How to read this page
Each row shows the time of its own data. Where the numbers come from is in "How we know" at the end of the page.
Feeds on this page
- Ski resort snow and lift reportlimit 2 h
- SNOTEL snowpacklimit 12 h
- Sierra Avalanche Center dangerlimit 2 h